
How are you all doing ? Hope good yeah ...
So i already didn't update in here for 1 month, rite ? Well well well ... Never mind , i was BACK here ...
So as usual let we see what we have in Forex Factory
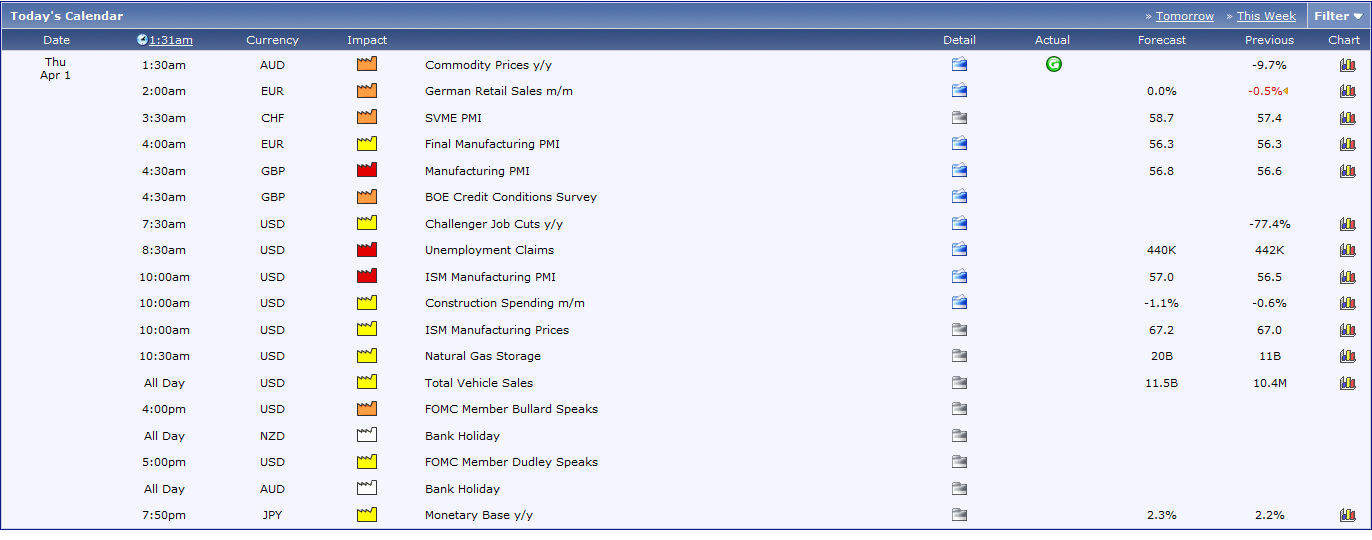 So we have here is Unemployment Claims for USD and ISM Manufacture for USD.
For unemployment i can say here it will be bullish for USD , why ? it was because previously is 442K but forecast is 440K, it mean decreasing for unemployment,so currency will increasing rite after the news happen..Furthermore we have to see how about the actual figure appear.
For ISM manufacture, it is more about Manufacture in US. The reading is is just if indicator changing is increasing, the currency also will decreasing...
So now let we see the Technical Analysis for
EUR/USD
 So for this chart, i can say that i will change to Bearish..But it must cut thru the blue line and make sure a big red ball appear,then it definitely Bearish..
For the chart pattern i can see it has Double Top
For MACD : on the 0-level and once it appear under the 0-level it will go bearish
For SSD n RSi : its already at oversold level, i have to wait it pointing up for the last move before it will turn down.
GBP/USD
 So what we have in Gbp/USD ? it is playing at overbought level rite ?
Chart pattern say it has Double Top, mean it want to go Bearish after this.
MACD : it still above the 0-level..so we have to wait until it appear below the 0-level.
SSD & RSI : still playing at overbought level
What ever it is, we have to make sure that all the indicator make a clear and confirm before we enter any position..
Happy Trading ... See you tomorrow for the result ... :)
No comments:
Post a Comment